
We’ve already had a look at Facebook and YouTube analytics, now let’s turn our attention to Twitter. Twitter analytics gives you information and stats about your last 28 days of tweets. You can find all this juicey stuff it by logging into your Twitter account at this URL https://analytics.twitter.com
OVERVIEW

The main bar chart (above) shows each days impressions and underneath that you’ll see individual stats for each tweet (see image below).
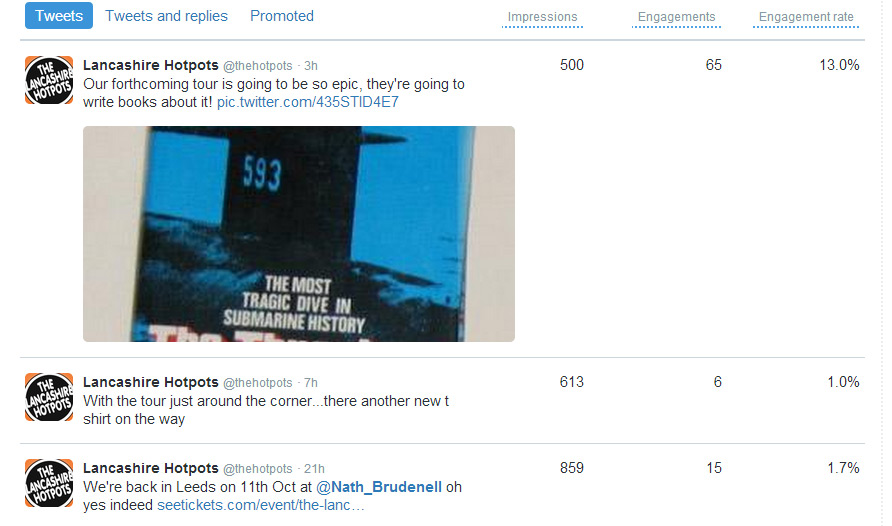
Impressions are the number of times your followers saw your tweets. Engagement is the number of fan interactions each tweet received and the Engagement Rate is interactions expressed as a percentage of impressions.
 On the right hand side of your individual tweet data there are individual graphs giving you information on amount of engagements, the number of daily replies, favorites and retweets etc. Here you you can see which posts have generated the most reactions from your followers. The idea is once you know what your fans respond to most you can then do more of the things they like to make more of an impact on Twitter.
Don’t forget to check out the Followers tab on the main page. You can use this to see what interests your fans have, the idea is that knowing this information you will be able to tweet more about this type of of content.
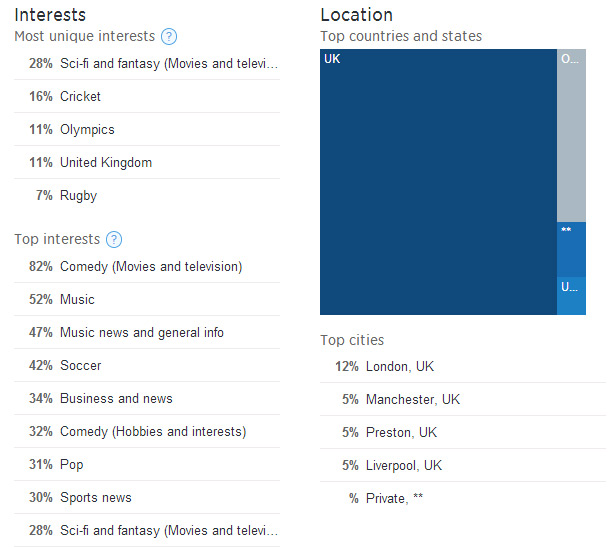
It even tells you their location. Cross reference this data with the locations of your Facebook followers to get accurate location demographics and plan your subsequent gigs accordingly!
Categories: Uncategorized
