
We saw yesterday why you should use analytics to assess what works with social media. Today we’ll get started with Facebook and the its analytical ‘Overview’ Page. To access it, click your Insights Tab at the top of the page on the desktop version of Facebook. The Overview page comes up by default.

OVERVIEW PAGE
The overview page gives us a seven day snapshot of keys stats which shows how well your page has been doing for the past week. It covers
- Likes (total and new likes)
- Post reach (how many people have seen your material in their newsfeeds)
- Engagement (how many people have clicked like, replied to a post etc.).
The ‘thinner lines on the graphs are last week’s data so you can see if you are ‘up or down’.
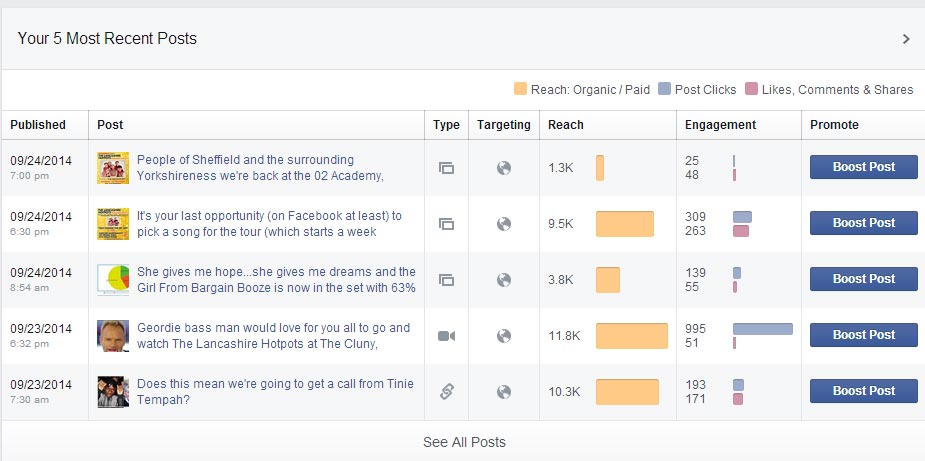
It also shows your five most recent posts with ‘at a glance’ pictorial information regarding reach and engagement. Here you can see how well your current posts are performing.
We’ll delve deeper by looking at the ‘Reach Page’ tomorrow.
Categories: Uncategorized

4 replies ›